Click Analytics from your Concord homepage to access the Insights Dashboard, which gives you a comprehensive overview of the activity in all your documents.
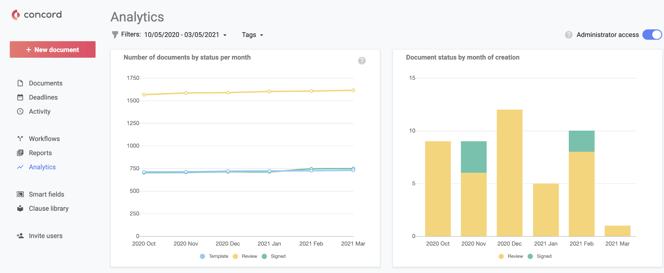
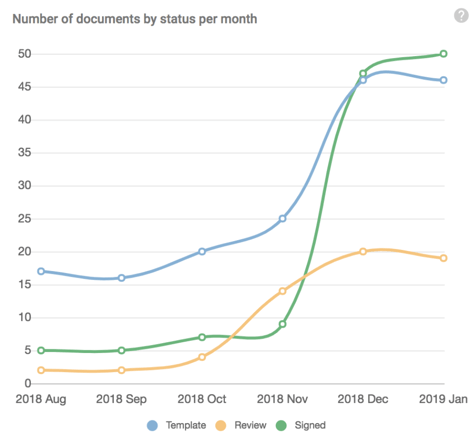
Number of documents by status per month
- This line chart displays the total number of documents to which you have access, organized by stage: Template, Review, and Signed.
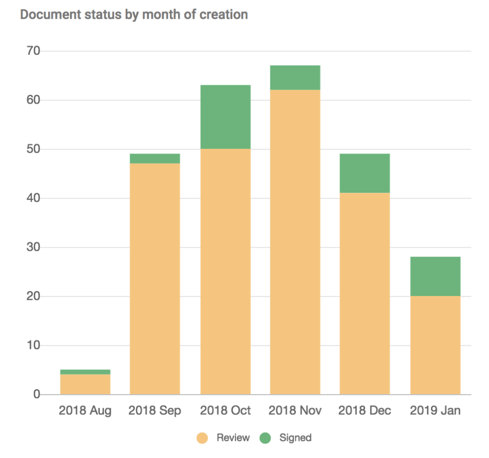
Document status by month of creation
- This stacked bar chart displays the current stage of documents (to which you have access), grouped by the month they were created in Concord. Green sections represent Signed documents, while orange sections represent documents in the Review or Signing stage.
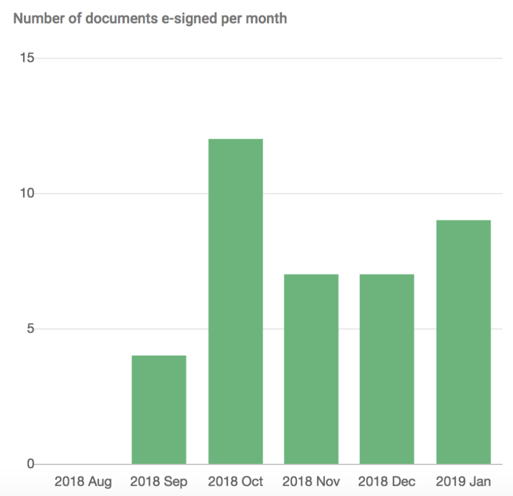
Documents e-signed on Concord per month
- This bar chart displays the number of documents that were e-signed through Concord. Hovering your cursor over the green bars will display the number of documents you have access to that were signed within a specific month.
Status of executed documents by month of signature
- This stacked bar chart displays the current status of signed documents to which you have access.
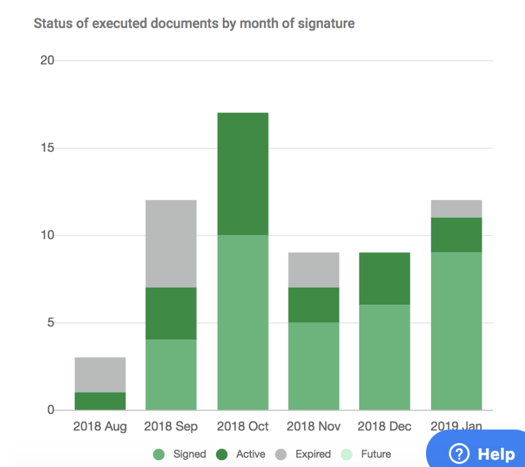
- Hovering your cursor over the dark green sections will display the number of documents that are currently Active.
- Hovering your cursor over the medium green sections will display the number of documents in the Signed stage but do not have a different status. This means the lifecycle section of the summary sheet has not been completed for these documents, and Concord cannot determine whether the contract is active.
- Hovering your cursor over the light green sections will show the number of documents that will become active in the Future.
- Hovering your cursor over the grey sections will show the number of expired documents, either because they have ended or have been terminated.
Deadlines
- The Insight page in the Deadlines section of reporting contains information on upcoming termination and renewal dates.
Number of documents ending or renewing per month
- This bar chart displays the number of documents with upcoming terminations and renewals per month.
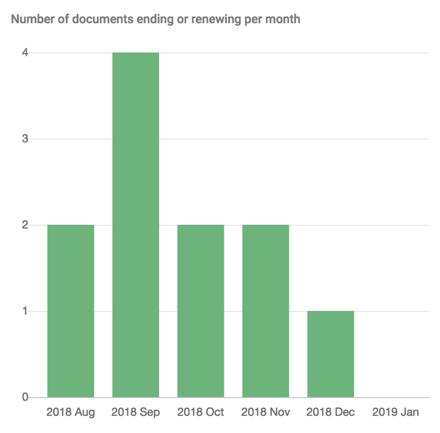
- Hovering your cursor over each bar will show the number of documents with upcoming terminations and renewals in the coming months.
- If you have not completed the lifecycle information for a signed document, it will not be represented in the deadline insight charts.
- This graph does not consider any advanced notices of termination that you or your team have configured on documents.
Number of documents with lifecycle deadlines per month
- This bar chart displays upcoming dates for termination, renewals, and the configured advanced notice of impending termination set in the lifecycle section of the summary sheet.
- For signed documents with a Termination notice value entered, this chart offers an at-a-glance view of the coming "actionable" deadlines, allowing you to forecast your future workload correctly. In these instances, the notice date is the only date reflected in the chart.
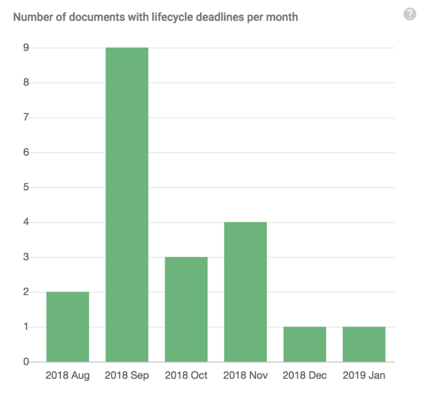
- Hovering your cursor over the bar will show the number of documents requiring termination or renewal actions in that month.
Filters and Export
- You can filter the data that populates the Insights charts by date range, tags, and, if you are an administrator, by Admin Oversight. Apply a filter, select the corresponding filter tab at the top of the page and select a new date range or more tags.
- To activate the Admin Oversight, enable the toggle in the top-right corner of the page. If you are a user without administrator status, you cannot access documents you are not a participant, so enabling the Admin Oversight filter will not impact the insight charts.
Admin Oversight
- When Admin Oversight is enabled, the charts will display data for all the documents in your company account.
- When Admin Oversight is disabled, the charts will display data for only the documents on which you are a participant.